
People analytics · Employee surveys · Fairness
BlissPoint Insight Studio for HR
Run the survey, find the gap, check it is real and fair, and show leaders one clear page. No analyst, no export.
Who is this for?
- HR business partnersYou’ll use it to answer “is turnover higher on one team, and is the gap real?” in minutes.
- People analytics leadsYou’ll use it to run engagement, exit and pulse surveys and test the results without SPSS.
- Founders of 20 to 500-person companiesYou’ll use it to check pay, promotion and hiring outcomes for adverse impact before a lawyer asks.
Not for you if you need a full HR system of record (use Organization Viewer or your HRIS); or you want legal advice: the fairness check is a statistical screen.

Collect, Clean, Ask, See, Share
HR questions are about people, so the answer has to be right, private and fair. Insight Studio builds all three into every step.
Collect
Build a survey with skip logic and anonymous links, or upload a CSV or Excel file. Survey answers land in the workspace with no export.
Clean
Studio finds blanks, duplicates and mixed types and suggests fixes in plain words. Every change is listed, and every change can be undone.
Ask
Type a question such as “Is turnover higher on one team?” Studio shows the plan first, picks the right test, checks its assumptions and switches test when they fail.
See
Each answer says what it means, how sure we are and how big the difference is, with a chart picked for the data. Change the chart in one click.
Share
Pin answers to a dashboard, send a view-only link, or download a PDF or slides in plain English or APA style, with R and SPSS syntax to rerun it.
From survey to a fair, clear answer
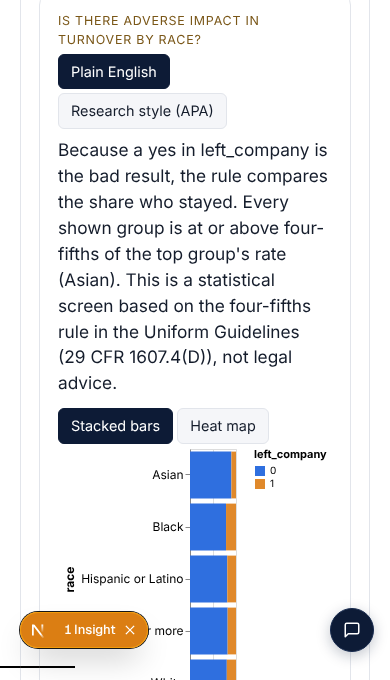
Fairness check on every comparison
Any group comparison gets the four-fifths rule impact ratio from the Uniform Guidelines (29 CFR 1607.4(D)), a significance test and the size of the gap. It is a statistical screen, not legal advice.
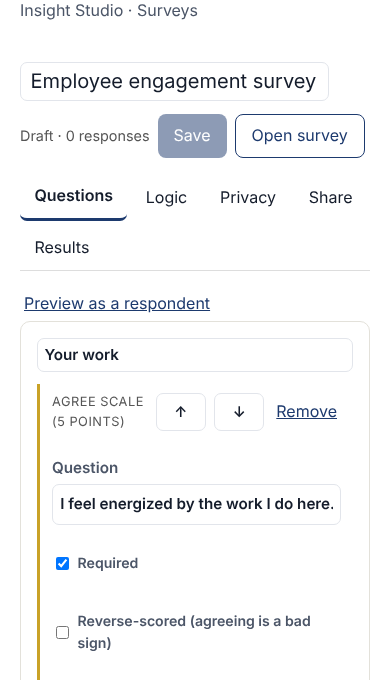
Anonymous surveys with HR templates
Engagement, exit and pulse templates, reverse-scored items, skip logic and anonymous links. Groups under five people are never shown.
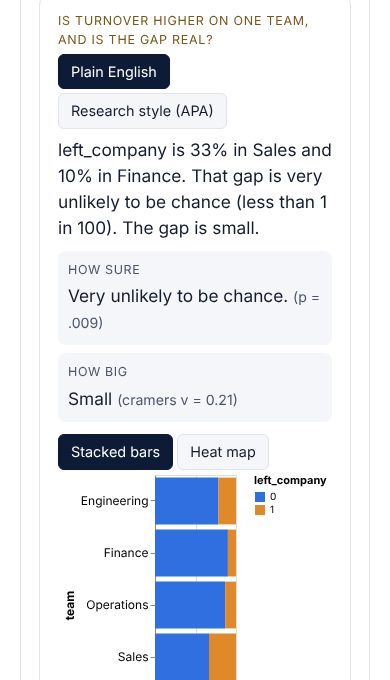
Plain answers leaders read
Every result says what it means, how sure and how big, then goes to a dashboard or a PDF for the leadership meeting.
Screens are the live product at phone width, on a fictional 300-person HR file.
How it compares
The tools people usually stitch together, with published or reported prices checked on . Insight Studio does the common jobs of each in one flow, plus three things none of them do: it switches test when assumptions fail and says why, runs a four-fifths fairness check on any group comparison, and hides small groups everywhere.
| Tool | Price | Strong at | Missing for this job |
|---|---|---|---|
| Insight Studio | Free; Team $39 a month (3 people); Pro HR $129 a month (10 people) | Survey to answer to report in one flow, in plain English and APA | No data warehouse connections or custom code |
| IBM SPSS StatisticsStatistics | Base from about $79 to $109 per user a month; add-ons extra (IBM) | Every classic test, syntax | No surveys or dashboards; output is not in plain English |
| SAS ViyaStatistics | Quote only (free OnDemand for Academics for learners) (SAS) | Enterprise analytics and programming | Built for programmers and large teams |
| StataStatistics | Annual license; business Stata/SE reported at $1,015 a year (Stata) | Reproducible do-files, econometrics | Command syntax; no surveys or sharing |
| JASPStatistics | Free, open source (JASP) | APA tables, Bayesian tests | Desktop app; no surveys, cleaning log or team sharing |
| jamoviStatistics | Free desktop; cloud has a free guest tier (SourceForge listing) | Spreadsheet plus tests, R syntax | No surveys, dashboards or fairness checks |
| TableauDashboards | Creator $75, Explorer $42, Viewer $15 per user a month, billed yearly (Tableau) | Drag-and-drop charts and dashboards | No significance tests; data must arrive clean |
| Power BIDashboards | Pro $14, Premium Per User $24 per user a month (AlphaBOLD pricing guide) | Dashboards inside Microsoft 365 | Formula language to learn; no statistical tests |
| Looker StudioDashboards | Free; Pro $9 per user per project a month (Coupler.io) | Free dashboards on Google data | Shallow analysis; no tests |
| QualtricsSurveys | Quote only, annual contracts (CostBench) | Survey logic, Stats iQ, employee experience | Price; comment analysis (Text iQ) is often a paid add-on |
| SurveyMonkeySurveys | Team Advantage about $30 per user a month, 3 seats minimum (Usercall pricing guide) | Easy builder and templates | Basic crosstabs; comment sentiment only on some plans |
| Culture AmpEmployee surveys | Quote only; third-party estimates about $5 to $9 per employee a month (Capterra) | Engagement templates, anonymity rules, benchmarks | Fixed reports; comment themes come in the quote-priced Engage package |
| Julius AIAI analyst | Free tier; Plus $20, Pro $45 a month (Julius AI) | Chat with a spreadsheet | Generated code with no assumption checks shown |
Prices change; check each vendor before you buy. Third-party figures are estimates where the vendor sells by quote.
Side by side: vs. Culture Amp · vs. Qualtrics · vs. SurveyMonkey · vs. SPSS
Private by default, checked against R
- Encrypted in transit and at rest.
- Never used to train AI models. When you ask a question, the AI that drafts the plan sees the question and the column names, never your rows.
- Choose where it is stored: US by default, EU storage on Pro HR.
- Groups smaller than five people are hidden in every table, chart, dashboard, export and share link.
- Delete a dataset, a survey or your whole workspace at any time; deleted means deleted.
- Local-only mode keeps raw rows in your browser and sends only summary numbers to the stats service.
Every test is checked against R reference results: 84 checks on R’s own example data, largest difference 0.0047. See the accuracy table. Roles, encryption and storage are on Trust & security.
Pricing
Free
$0
1 person
- 500 rows per dataset
- 1 survey, 50 responses
- Every test and fairness check
- PDF reports (watermarked)
Team
$39 a month
3 people
- Unlimited surveys and HR templates
- Dashboards and share links
- PDF and slides, APA style, R and SPSS syntax
- Google Sheets
- 50% off for researchers with a .edu address
Pro HR
$129 a month
10 people
- HR-system and Qualtrics imports
- Scheduled reports by email
- EU data storage
- Audit log export
- One expert review each quarter
Prices per month, billed monthly. Researchers with a .edu address get 50% off Team.
Questions
What is the four-fifths rule?
A screen from the Uniform Guidelines on Employee Selection Procedures (29 CFR 1607.4(D)): if one group's selection or success rate is under 80% of the highest group's rate, that is generally treated as evidence of adverse impact. Studio computes it on any group comparison. It is a statistical screen, not legal advice.
Can employees be identified from the results?
Groups smaller than five people are hidden in every table, chart, dashboard, export and share link, including the group that would let someone work out a hidden one by subtraction.
Can it find themes and sentiment in survey comments?
Coming soon. Comment analysis (the main themes and whether the tone is positive or negative) is the next feature we are building, on every plan. Culture Amp includes it in a quote-priced package and Qualtrics often sells Text iQ as an add-on. Today Studio surveys collect comments and you can download them.
Can I import from our HR system?
Yes. Upload an export from BambooHR, Gusto, Rippling, ADP or Workday, or a Qualtrics export. Pro HR adds saved imports.
Is my data used to train AI?
No. Your rows are never used to train AI models. The AI that drafts an analysis plan sees only your question and the column names.
How do I know the numbers are right?
Every test is checked against R reference results on R's own example data: 84 checks, with the largest difference 0.0047 on values R prints to four digits. The table is on the research page.
What does it cost?
Free for one person on files up to 500 rows. Team is $39 a month for 3 people and Pro HR is $129 a month for 10 people. Researchers with a .edu address get 50% off Team.
Who built it?
Anthony L. Hammock, M.Sc., a 20+ year Industrial and Organizational Psychology consultant, software developer, and Graduate Studies Professor, Talent Insights and Workforce Metrics, Brandeis University.
Comment Boxes: Themes and Sentiment
Every engagement survey has comment boxes, and HR teams want to know what people are saying: the main themes and whether the tone is positive or negative. The big survey tools keep this behind a sales quote, a paid add-on or a higher plan. Insight Studio's comment analysis, with themes and sentiment on every plan and small groups still hidden, is coming soon. Today you can collect comments in Studio surveys and download them. Sources: Culture Amp plans, Qualtrics pricing guide, SurveyMonkey text analysis.