
What are the best job categories after AI?
Ranked on BLS and O*NET data, the five job families with the most growing occupations that score low for generative AI exposure are healthcare practice and support; skilled trades, installation and repair; transportation and material moving; personal care and community services; food service, building and grounds. This free whitepaper shows the evidence and example occupations for each.
No job family is AI-proof. Each family is ranked by how many of its growing occupations score at or above the median for low exposure, with approximate new jobs as the tiebreak.
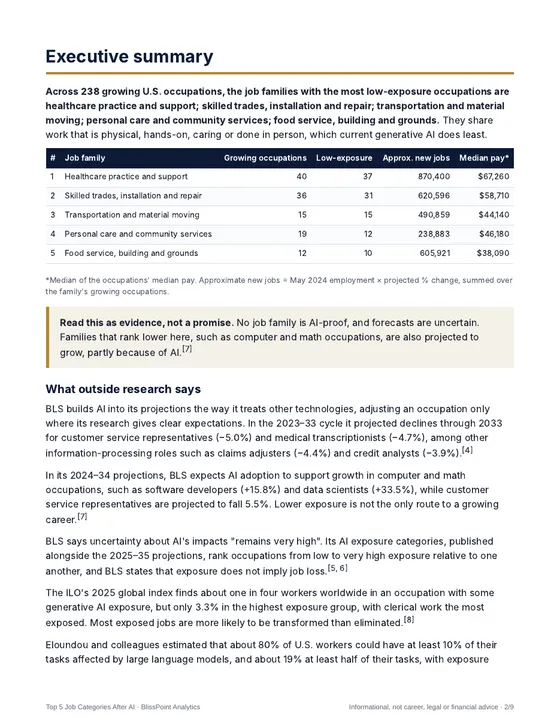
Healthcare leads clearly: 37 of its 40 growing occupations score at or above the median for low exposure, with about 870,400 new jobs projected. The skilled trades follow with 31 of 36 and about 620,596 new jobs. Transportation and material moving is the only family where every growing occupation, 15 of 15, scores at or above the median.
The five families at a glance
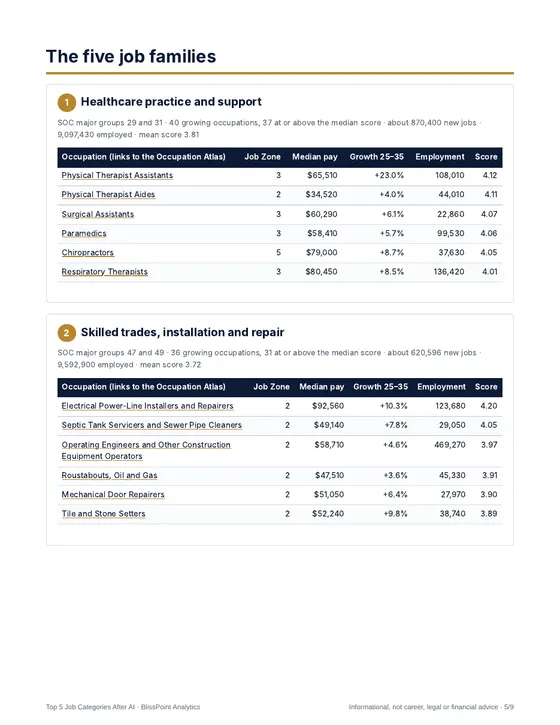
Each family below lists its strongest examples from the paper. Pay is the BLS median for May 2024; growth is the BLS projection for 2025 to 2035, against +3.5% for all occupations.
1. Healthcare practice and support
Physical therapist assistants (+23.0%), surgical assistants, paramedics, chiropractors and respiratory therapists. The family's median of median pay is $67,260.
2. Skilled trades, installation and repair
Electrical power-line installers and repairers top the whole study, with median pay of $92,560 and growth of +10.3%. Operating engineers, tile and stone setters and mechanical door repairers follow.
3. Transportation and material moving
Crane and tower operators, transit and intercity bus drivers, shuttle drivers and flight attendants: work that happens in person, with equipment or with the public.
4. Personal care and community services
Skincare specialists, healthcare social workers, hairdressers and fitness instructors, with 12 of 19 growing occupations at or above the median.
5. Food service, building and grounds
Tree trimmers, pest control workers and restaurant cooks, an occupation of 1,452,130 jobs projected to grow +12.1%.
Why computer and math jobs are not in the top five
Many computer and math occupations are growing, partly because of AI: BLS expects AI adoption to support growth for data scientists (+33.5%) and software developers (+15.8%) in its 2024–34 projections. Their work is mostly information processing, so they score as more exposed. Exposure is not job loss; it is one lens among several. Only 1 of 44 science, engineering and technology candidates and none of 35 in management, business and finance reached the low-exposure median.
How the ranking works
The paper starts from every O*NET occupation with a BLS row, keeps those with at least 20,000 jobs and projected growth at or above the +3.5% average, and leaves 238 candidates. Each gets the same lower-exposure score as the companion list of 50 jobs that will survive AI. SOC major groups are combined into 13 job families, and a family's rank is the number of its candidates scoring at or above the median of 3.53, with approximate new jobs as the tiebreak.
Approximate new jobs is May 2024 employment times the projected percentage change, summed over the family. It is a rough guide, not a BLS figure.
Turning a job family into a plan
Pick the family closest to work you already enjoy, then open its occupations in the free Occupation Atlas to compare tasks, training and pay. Career changers can search by skill to find occupations that use what they already do. Employers planning for 2030 can profile their own roles with the 2030 skills calculator.
Families that rank lower are not closed doors. Protective services had 5 of 7 growing occupations at or above the median, production 4 of 9 and education and training 2 of 9. The score describes today's work as O*NET rates it; it does not model robotics, regulation, demand or wages, and it cannot see how fast AI tools will change. Where BLS has studied AI effects occupation by occupation, its published projections already include them.
Informational, not career, legal or financial advice. Forecasts are uncertain, and no job family is AI-proof.
Frequently asked questions
Is any job AI-proof?
No. These lists rank occupations by how exposed their day-to-day work looks to generative AI in O*NET data today, among occupations BLS projects to grow. Tools, demand and employers will change, and forecasts are uncertain.
Where do the numbers come from?
Median pay and employment are BLS Occupational Employment and Wage Statistics for May 2024. Growth is the BLS projected change for 2025 to 2035, against +3.5% for all occupations. Work activities and context are from O*NET 31.0.
Is this career advice?
No. The papers are informational, not career, legal or financial advice. Use them to choose occupations to research, then read each one's Occupation Atlas page.
Why aren't computer and math jobs in the top 5?
Many of them are growing, partly because of AI, but their work is mostly information processing, so they score as more exposed. Exposure is not job loss; it is one lens among several.
Which job family is least exposed to AI?
In this ranking, healthcare practice and support: 37 of its 40 growing occupations score at or above the median for low exposure, with about 870,400 new jobs projected for 2025 to 2035.
What does approximate new jobs mean?
May 2024 employment times the BLS projected percentage change, summed over a family's growing occupations. It is a rough guide, not a BLS figure.
Sources
- U.S. Bureau of Labor Statistics: Occupational Employment and Wage Statistics, May 2024
- U.S. Bureau of Labor Statistics: Employment Projections, 2025–35
- U.S. Bureau of Labor Statistics: Incorporating AI impacts in BLS employment projections (Monthly Labor Review, February 2025)
- U.S. Bureau of Labor Statistics: AI exposure categories
- O*NET 31.0 Database, National Center for O*NET Development