


How do you align headcount planning with the financial forecast?
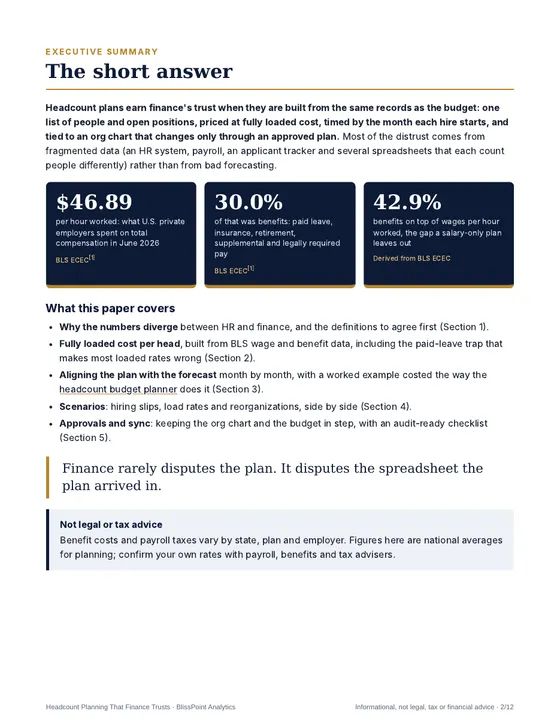
Headcount plans earn finance's trust when they come from the same records as the budget: one list of people and open positions, priced at fully loaded cost, timed by each hire's start month, and tied to an org chart that changes only through an approved plan. This free whitepaper shows how, with BLS cost data.
Written for CFOs, FP&A and HR partners whose workforce cost data is fragmented and not audit-ready. Figures are from the BLS Employer Costs for Employee Compensation survey, and the worked example is costed the way the headcount budget planner does it.
Why the numbers diverge
Ask HR and finance how many people the company employs and you will often get two numbers, both right. HR counts people on the org chart, including open roles; finance counts people on payroll this period. HR costs a hire from the accepted offer; finance from the first payroll. The paper sets out six definitions to agree first, from headcount versus FTE versus positions to which system wins, field by field.
That is what "not audit-ready" means in practice: a figure cannot be traced back to a record. The fix is structural: fewer copies, one position list, one loaded-cost rule and dated versions of the plan.
Turnover belongs in the plan
Plans that assume no one leaves will under-hire. U.S. quits averaged 2.0% of employment a month in 2025, so even a stable team needs backfills. Use your own 12-month voluntary rate by department, and decide whether backfills are already in the budget, since replacing a leaver at similar pay adds no cost, or are new money.
Fully loaded cost per head, and the paid-leave trap
In June 2026, U.S. private employers spent $46.89 per hour worked on compensation: $32.82 in wages and salaries and $14.07, or 30.0%, in benefits. Because the ECEC survey measures cost per hour worked, it counts paid leave as a benefit, and an annual salary already pays for vacation and holidays. Adding the full ratio on top of salary counts paid leave twice.
Three load rates from the same data
All benefits per hour worked gives 42.9%, right for pricing hours actually worked. Excluding paid leave gives 29.0%, a reasonable first draft for annual salaries. Excluding paid leave and supplemental pay gives 23.8%, for budgets that carry bonuses and overtime on their own lines. A national average is a sense check, not a rate; payroll's own figure comes first.
A worked plan by month and quarter
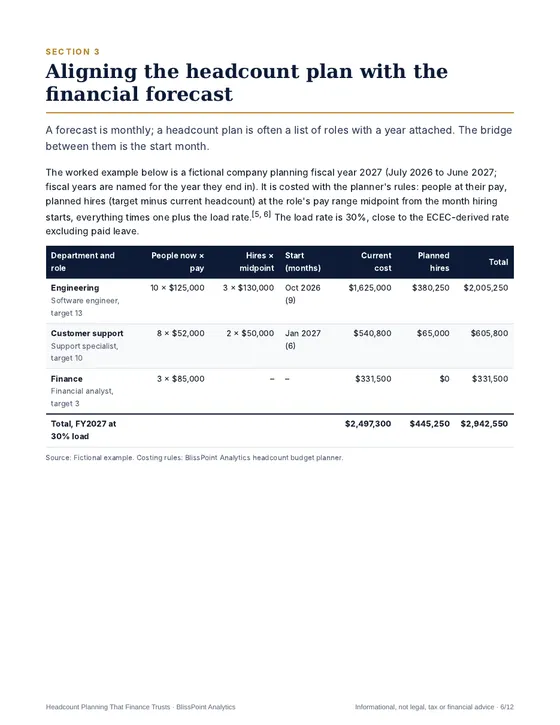
The paper costs a fictional company's fiscal 2027 with the rules of the headcount budget planner: people at their pay, planned hires at their role's pay range midpoint from the month they start, everything times one plus a 30% load. Three engineers starting in October cost nine months each, $380,250 rather than $507,000. The year totals $2,942,550, and a plan that showed only Q4's run rate would overstate this year's cost by $191,750.
Scenarios finance will ask for
A one-quarter hiring delay is worth $159,250 in the example, almost as much as the $113,175 between a 25% and a 30% load rate. Both belong in the forecast conversation before the year starts. Reorganization scenarios show the same plan's cost on a draft chart, by department, without touching the live one.
Approvals and an audit-ready checklist
Propose a change as a scenario, cost it with the agreed load rate, have the budget owner sign the difference, make only the approved version live, and reconcile with payroll monthly. The checklist's tests are simple: one position list, one signed load rate, dated start months, a versioned plan, totals that reproduce from the export, access control on pay, and monthly variance explained by cause. Audit-ready means boring: every figure has a record, an owner and a date.
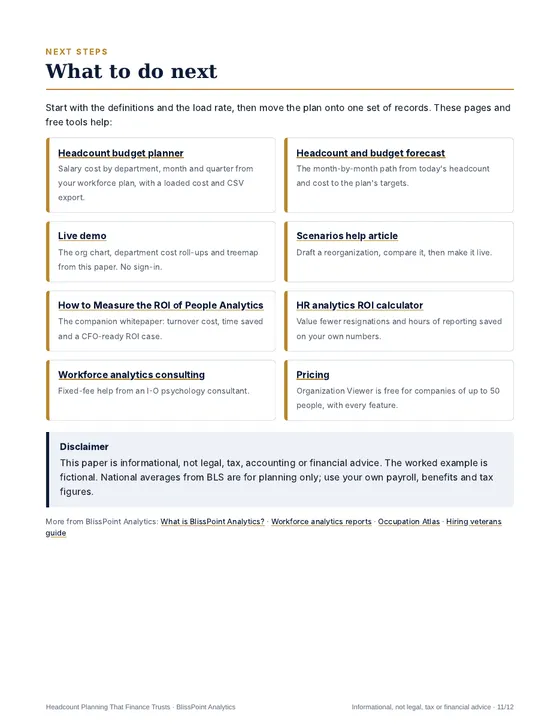
Start with the headcount and budget forecast or explore the live demo. The companion paper, How to Measure the ROI of People Analytics, uses the same cost discipline for the benefit side.
Informational, not legal, tax, accounting or financial advice. The worked example is fictional; BLS figures are national averages for planning.
Frequently asked questions
How do you align headcount planning with financial forecasts?
Build the plan from one list of people and open positions, price each at fully loaded cost, give every planned hire a start month so cost is prorated, show the result by month and quarter, and change the org chart only through an approved version of the plan.
Why is workforce cost data so often not audit-ready?
Because it is spread across an HR system, payroll, an applicant tracker and spreadsheets that count people differently. When a plan is stitched together by hand, no figure can be traced back to a record. One position list, one load rate and dated plan versions fix most of it.
What is a fully loaded cost per head?
Salary times one plus a load rate for benefits and employer taxes, plus per-head overhead. In June 2026, U.S. private employers spent $46.89 an hour on compensation, 30.0% of it on benefits (BLS ECEC). Because ECEC counts paid leave as a benefit, the load on an annual salary is lower: about 29% excluding paid leave, or about 24% excluding paid leave and supplemental pay, by our calculation from the same data.
Does Organization Viewer route approvals?
No. It drafts changes as scenarios, costs them in the headcount budget and makes an approved scenario live; keep sign-offs in the system your finance team already audits.
Is this tax advice?
No. Benefit costs and payroll taxes vary by state, plan and employer. The paper is informational, not legal, tax, accounting or financial advice.