


How do you measure HR analytics ROI?
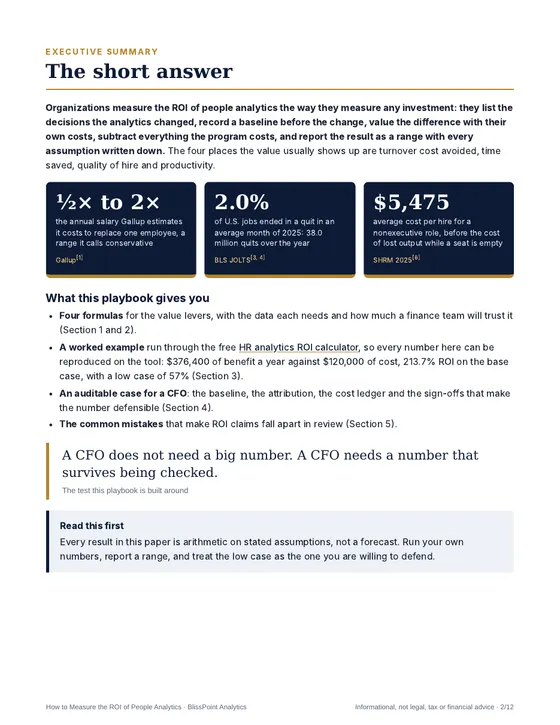
Organizations measure the ROI of people analytics by listing the decisions it changed, recording a baseline, valuing the difference with their own costs, subtracting the full program cost and reporting a range. This free playbook gives the formulas, a worked example that matches our ROI calculator, and a CFO-ready checklist.
Written for HR and finance leaders. Every figure is sourced to Gallup, SHRM or the Bureau of Labor Statistics, and the worked example can be reproduced on the free calculator.
The formula itself is short. ROI is total benefit minus program cost, divided by program cost; payback in months is program cost divided by monthly benefit. The work is deciding what goes on each side and showing the benefit came from the analytics rather than a cooling labor market, a new manager or a pay rise.
The four value levers
The playbook orders the levers by how readily a finance team will accept them.
Turnover cost avoided
Leavers avoided times cost per leaver. Two inputs carry the result: your replacement cost, built from cost per hire, vacancy time and ramp-up, and a clean baseline voluntary turnover rate. National quits fell from 2.8% of jobs a month in 2022 to 2.0% in 2025, so a company whose turnover fell over those years was partly riding the market. Group-level attrition analytics gives you the baseline by department, manager and tenure.
Time saved
Reporting hours that stop, times twelve, times a loaded hourly cost. Price hours at pay plus benefits: U.S. private employers spent $46.89 per hour worked on compensation in June 2026, $14.07 of it on benefits.
Quality of hire and productivity
First-year retention of new hires is the cleanest quality-of-hire measure, priced with the same replacement cost. Productivity is the hardest to attribute and needs a comparison group; without one, present it as a supporting observation, not part of the ROI.
A worked example you can reproduce
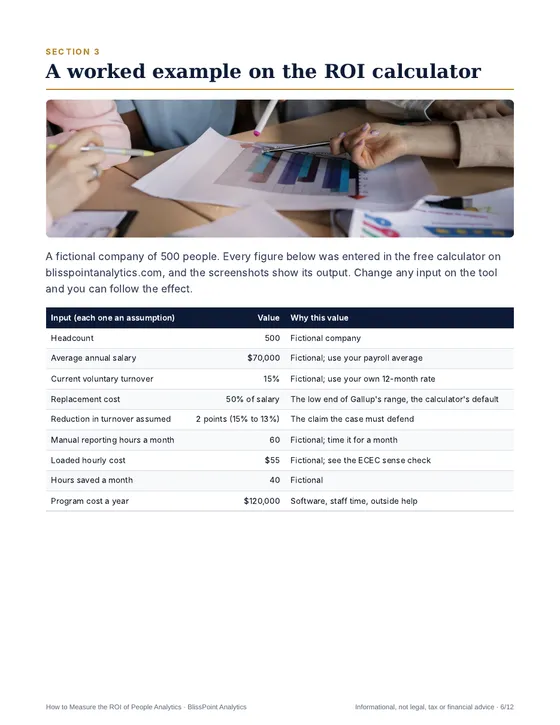
The paper runs a fictional 500-person company through the free HR analytics ROI calculator: 15% voluntary turnover, a $70,000 average salary, replacement cost at 50% of salary, a two-point turnover reduction, 40 reporting hours saved a month and a $120,000 program. Ten leavers avoided at $35,000 each is $350,000; time saved is $26,400. Total benefit of $376,400 gives a net benefit of $256,400, an ROI of 213.7% and payback in 3.8 months.
The low case, a one-point reduction and 20 hours saved, still returns 57%. The break-even is about three fewer leavers a year, which is often an easier conversation than defending 214%.
Two lessons fall out of the sensitivity grid. The turnover reduction matters more than any other input: each point is five people at $35,000 each in the example. And the replacement cost multiplies everything, which is why a CFO will ask where yours came from. At Gallup's high end of 200%, the same two-point reduction shows 1089%; a figure built from your own cost per hire, vacancy time and ramp-up survives review, and a borrowed multiplier may not.
Building a case a CFO will sign
An auditable case is one another person can rebuild from the same records. The playbook's six steps: write a decision log, freeze a dated baseline with its definitions, choose the attribution design before results arrive, keep a full cost ledger including manager time, get finance to sign the assumptions, and re-measure at 6 and 12 months, reporting unfavorable variances too.
The most common way to inflate a case is to leave out the manager time spent acting on findings. Others include counting all turnover rather than voluntary exits, borrowing the top of Gallup's range without your own cost build-up, double counting an early leaver under two levers, and scoring individual flight risk instead of acting on groups.
Where to go next
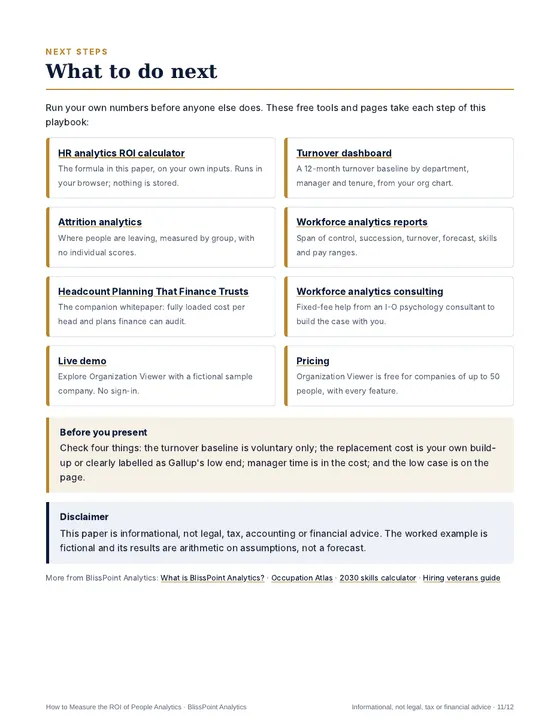
Run your own numbers on the calculator before anyone else does, then read the companion paper, Headcount Planning That Finance Trusts, for fully loaded cost per head. If you want help building the case, workforce analytics consulting offers fixed-fee projects with an I-O psychology consultant.
Informational, not legal, tax, accounting or financial advice. Worked examples are fictional and are not forecasts.
Frequently asked questions
How do organizations measure ROI from their people analytics investment?
They list the decisions the analytics changed, record a baseline before the change, value the difference with their own costs (such as the cost of replacing a leaver and the loaded cost of an hour of reporting), subtract the full program cost, and report ROI and payback as a low, base and high range with every assumption written down.
What formulas does the playbook use?
Turnover cost avoided = leavers avoided × cost per leaver; time saved = hours saved a month × 12 × loaded hourly cost; ROI = (total benefit − program cost) ÷ program cost; payback = program cost ÷ (total benefit ÷ 12). They match the free HR analytics ROI calculator, and the paper adds formulas for quality of hire and productivity.
What replacement cost should I use?
Your own, built from cost per hire, vacancy time and ramp-up. Gallup estimates replacing an employee costs one-half to two times annual salary and calls that range conservative; the calculator starts at the low end, 50%.
How do I make the ROI case auditable for a CFO?
Keep a decision log, freeze a dated baseline with its definitions, choose the attribution design before results are in, keep a full cost ledger including manager time, get finance to sign the assumptions, and re-measure at 6 and 12 months.
Is the worked example a forecast?
No. It is arithmetic on stated assumptions for a fictional company. The paper is informational, not legal, tax, accounting or financial advice.