
Employee turnover risk analysis and attrition analytics
Attrition analytics is an Organization Viewer tool that measures where people are leaving, by department, manager and tenure band, and shows an explainable turnover risk signal built from named factors, not a prediction about any person.
Most talk of an employee flight risk model means a black-box probability for each person: how likely they are to resign. Organization Viewer does not do that. Its attrition analytics measure where people are leaving, and its Turnover risk page shows the conditions that tend to come before it as a transparent signal, factor by factor, so retention effort goes where the risk is concentrated and every point can be explained.
It is built from the turnover dashboard and the related reports in Workforce analytics, all reading your live org chart. Risk prediction in talent management starts here: a reliable record of who left, from where and how soon, before any model.
Who is this for?
- HR leadersYou’ll use it to see which departments and managers carry the highest turnover, and how much is in the first year.
- People analytics teamsYou’ll use it to set a clean, group-level turnover baseline to measure retention changes against.
- ExecutivesYou’ll use it to answer "where are we losing people?" from the live org chart without exposing any individual.
What it does
- Records each departure when someone leaves your org chart, by hand or through your HR system sync, as resigned, let go or other. No names are kept with it.
- Shows the 12-month turnover rate, and resignations against people let go.
- Breaks turnover down by department and by manager. A group with fewer than 5 people, counting leavers, is folded into Smaller teams so no one's departure can be singled out.
- Counts leavers by tenure band (under 6 months, 6 to 12 months, 1 to 3 years, more than 3 years), with first-year leavers called out.
- Sits beside the risk signals other reports already show: people paid below their role's range (pay range review), managers with very wide spans (span and layers health check) and key roles with no successor (succession readiness).
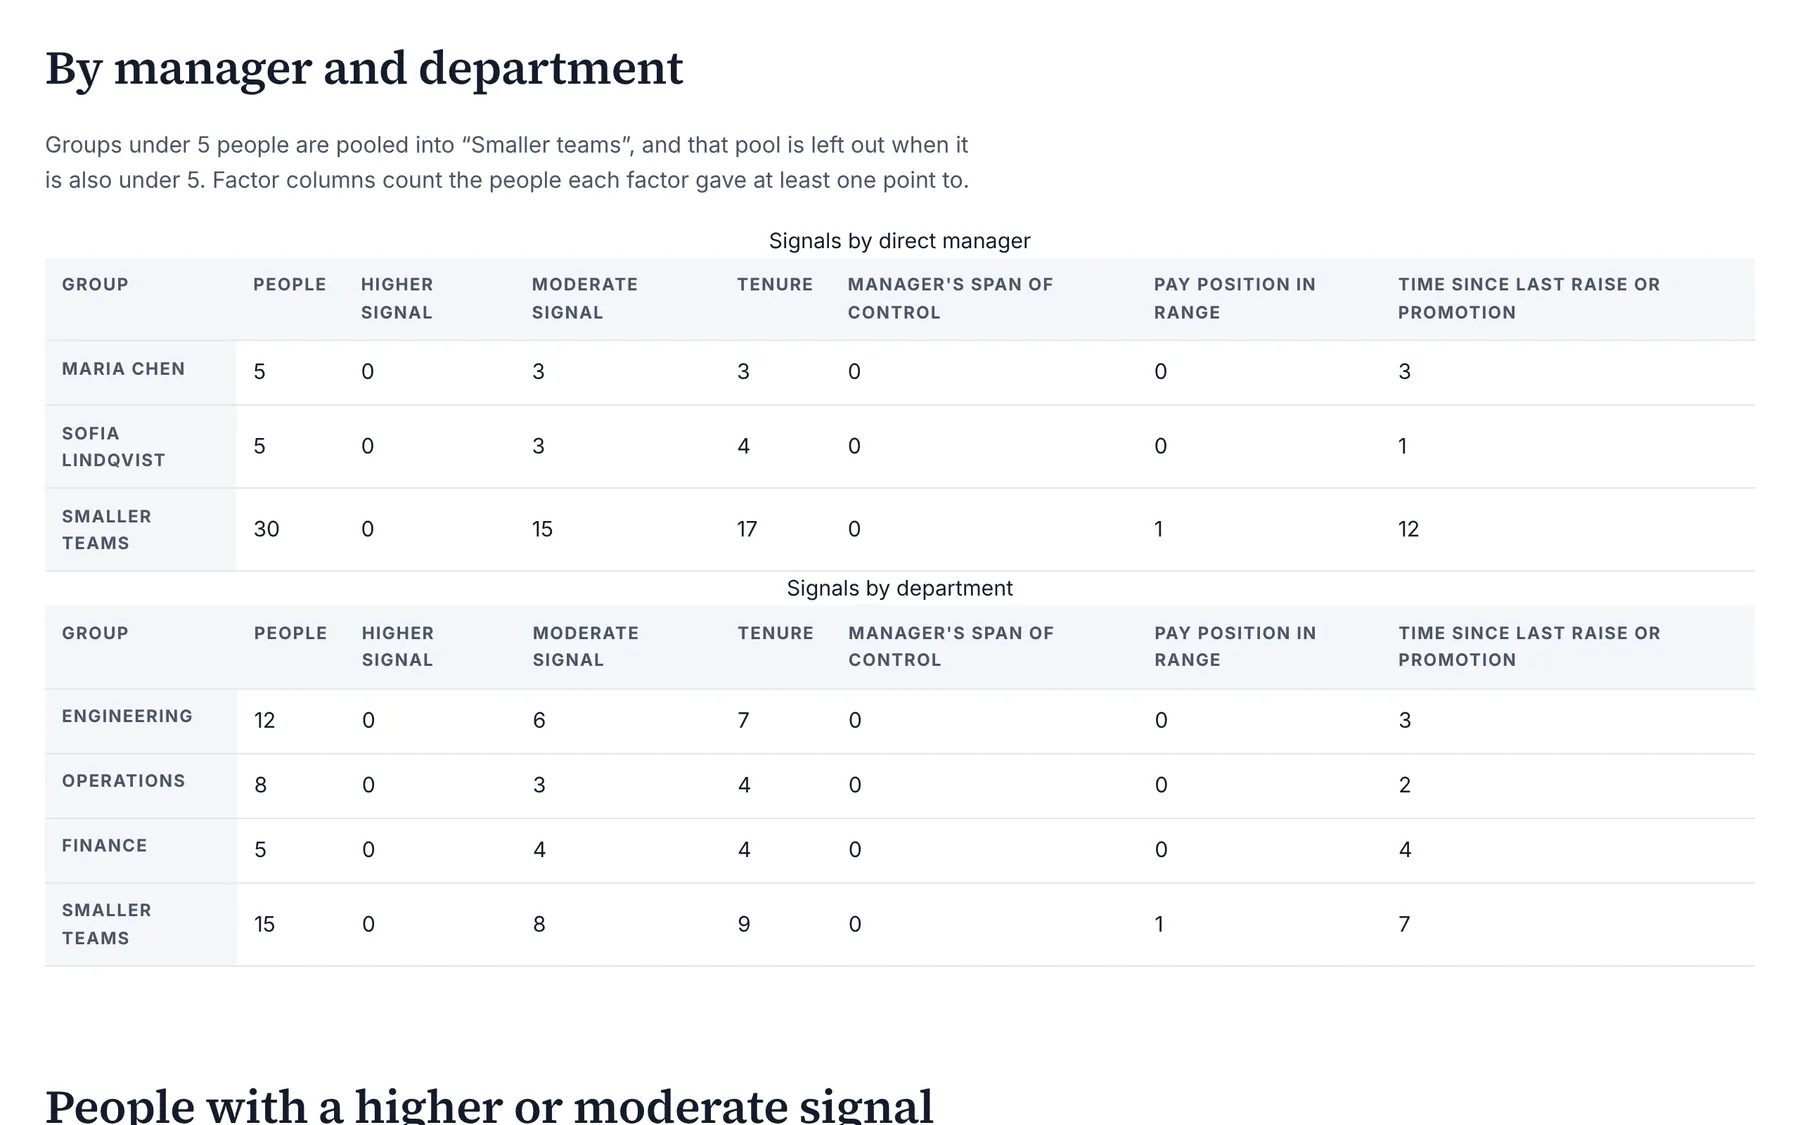
- Adds a Turnover risk page for owners and admins: a transparent risk signal per person from four named factors (tenure, the manager's span of control, pay position in the role's range, and time since the last raise or promotion), each shown with its points and the reason, rolled up by manager and department with small groups pooled.
- Pay factors are scored only for members who may see pay, and raise and promotion dates (date and type only, no amounts) come from a CSV import.
- The signal is a sorting rule, not a validated model and not a prediction about any person. It gives no probability of leaving.
What it costs: Included on every Organization Viewer plan, including Free for up to 50 people. Paid plans start at $300 a month for 51 to 250 people. See pricing.
How it works, step by step
- Keep your org chart current, by hand or by connecting your HR system. When someone is removed, choose whether they resigned, were let go, or the entry was a mistake.
- Import hire dates from a CSV to add tenure to every departure.
- Open Workforce analytics and choose Turnover to see the rate, the split by department and manager, and the tenure bands.
- Read it beside the pay range review, the span and layers health check and succession readiness, and decide where to act first.
- Owners and admins can open Turnover risk to see each person's signal factor by factor, and import raise and promotion dates (date and type only) to score the last-raise factor.
Feature details
How the turnover rate is calculated
- Leavers in the last 12 months divided by the average headcount, estimated as today's headcount plus half the leavers (the usual approximation when month-by-month headcount isn't kept).
- Groups are sorted by rate, highest first.
How the turnover risk signal is scored
- Tenure: under 12 months is 2 points, 12 to 23 months is 1.
- Manager span: 1 point when the person's manager has more direct reports than the healthy maximum used by the span and layers health check.
- Pay position: below the role's range minimum is 2 points, in the bottom quarter of the range is 1. Scored only for members who may see pay.
- Last raise or promotion: 24 months or more is 2 points, 12 to 23 months is 1.
- Share = points divided by the most points possible from the factors that could be scored. Higher is a share of 0.5 or more, moderate 0.25 or more. With fewer than 2 known factors, the page says there is not enough data.
- The point values and cutoffs are product choices to sort the list, not validated benchmarks.
Groups first, explained signals for individuals
- Departments and managers with fewer than 5 people, counting leavers, are combined into Smaller teams.
- The turnover reports describe groups, roles and the structure. The separate Turnover risk page gives each person an explainable, rule-based signal from four named factors, with the points and reason for each. It is not a prediction or a probability of leaving, and only owners and admins see it.
- Pulse surveys can ask "I expect to still be working here a year from now." Results are shown only for groups of 5 or more responses, never for one person.
Built on the turnover dashboard
The figures come from the turnover dashboard, one of the workforce analytics reports included on every plan. For what individual flight risk models do, their limits and how to use them fairly, read decoding flight risk; for how expected attrition feeds hiring plans, see predictive pipeline analytics.
To put a value on lower turnover with your own numbers, use the HR analytics ROI calculator. For help reading the patterns and acting on them, see workforce analytics consulting, or the short answer on the leading indicators of a retention problem.
The long version is a free whitepaper: 12 early warning signs of a retention problem, with what to measure for each and a monthly review. With pay ranges now public in many states, the pay transparency compliance guide 2026 covers pay below range from the other side. To turn a turnover baseline into a business case, read the free whitepaper How to measure the ROI of people analytics.
Part of Organization Viewer's HR and workforce analytics
This is one of five analyses that read the same org chart, with the same privacy rules and no extra cost. The others:
- Pay equity analysis software: Pay equity analysis in Organization Viewer is a regression-based audit that estimates the pay gap left unexplained by job level, job family, tenure, location and performance, for each sex and race/ethnicity group, with confidence intervals.
- Hiring funnel analytics: Hiring funnel analytics is an Organization Viewer tool that turns an applicant-tracking export into stage conversion and drop-off, time to hire, offer acceptance, source quality and an adverse-impact check at every stage.
- Employee engagement survey analysis: Engagement survey analysis is an Organization Viewer tool that scores each area of a pulse or imported survey, checks how consistent each set of questions is with Cronbach's alpha, compares groups, counts comment themes and suggests where to start.
- AI hiring bias audit calculations: AI hiring bias audit calculations are an Organization Viewer tool that works out selection or scoring rates and impact ratios for an AI hiring tool by sex, race/ethnicity and both together, the way New York City's rules for Local Law 144 set out, with a draft summary for your independent auditor.
See Organization Viewer, or create a free account and load the fictional sample company to try every analysis before entering real data.
Get expert help: an I-O psychology consultant can run this analysis with you in the People Insight module (Sum of parts $41,800; bundle $37,500 (save 10%)).
Questions
Does Organization Viewer predict which employees will leave?
No. It has no predictive flight risk model and gives no probability of leaving. It measures turnover for groups (departments, managers and tenure bands), and its Turnover risk page, for owners and admins only, gives each person a transparent, rule-based signal from four named factors, each shown with its points and reason, so you can see where risk is concentrated.
What is attrition analytics?
The practice of measuring and explaining employee departures: how many people leave, from where, how soon after joining, and why. Forecasting future attrition builds on that record.
How is an employee flight risk model different?
A flight risk model estimates the probability that an individual leaves, from data such as tenure, pay position and manager changes. Probabilities about people are easy to misuse, which is why Organization Viewer gives no probability: its Turnover risk page shows a rule-based signal whose every point is explained, and its turnover reports cover groups.
Where does the departure data come from?
From your org chart: each time someone is removed by hand or by an HR system sync, a departure is recorded with its date, department, manager and reason.
Does it cost extra?
No. Turnover and the related workforce analytics reports are included on every Organization Viewer plan.
Learn more
Help articles
Related consulting
Related features
- Pay transparency tracker
- AI hiring tool inventory
- Manager and 360 surveys
- Headcount budget planner
- Directory sync and chat alerts
- Pay equity analysis
- Hiring funnel analytics
- Engagement survey analysis
- AI hiring bias audit calculations
- Booking and review requests
- Structured interview scorecards
- Job analysis wizard
- Onboarding plans
- Adverse-impact checker
- Requisitions
- Offer and pay-range check
- Goals and check-ins
- Review cycles
- 9-box calibration
- Team health dashboard
- Workforce analytics tools
Start with the sample, or with your own org
Sign-in is a one-time email link, with no password and no credit card. Load the fictional sample company to see every feature working before you enter real data.