

What are the early warning signs of a retention problem?
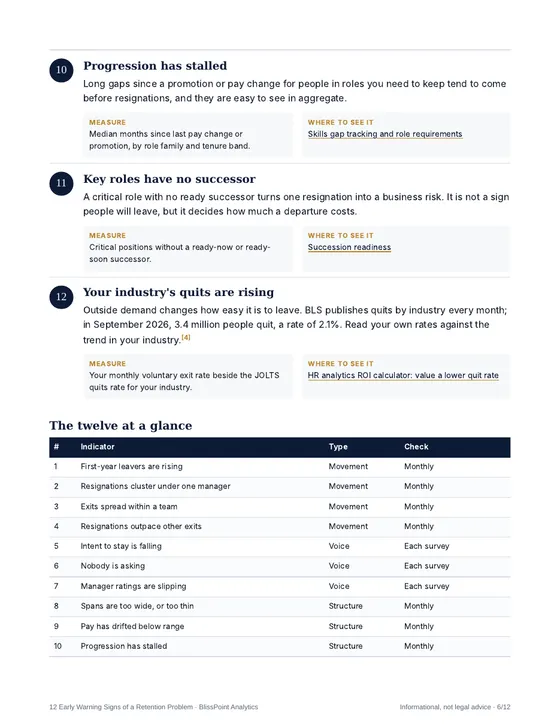
The leading indicators of a retention problem are rising first-year leavers, resignations clustering under one manager or spreading within a team, falling intent to stay, missing stay conversations, slipping manager ratings, wide spans, pay below range, stalled progression, key roles without successors and rising industry quits. Read them for groups, months before the turnover rate moves.
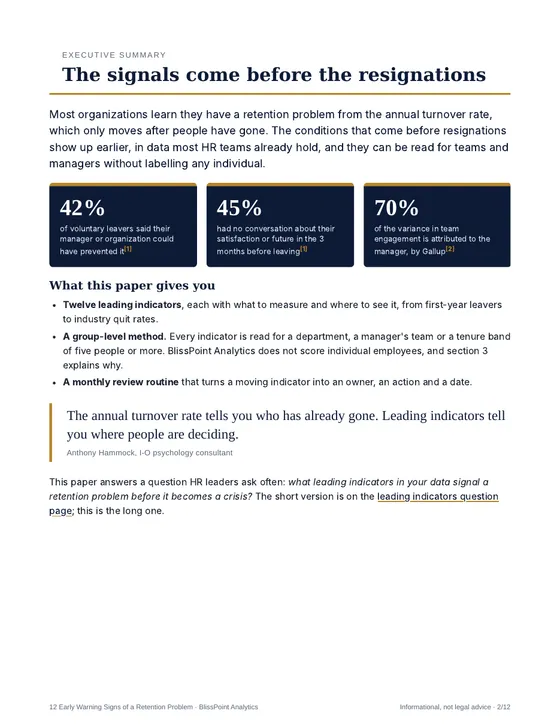
Gallup's 2024 study of voluntary leavers found 42% said their manager or organization could have prevented it, and 45% had no conversation about their future in their last three months. This free paper sets out twelve indicators, what to measure and where to see each one, and a monthly review that turns them into action.
The window is real and often missed. Gallup's 2024 study of voluntary leavers found 42% believed their manager or organization could have done something to keep them, and 45% had no conversation about their satisfaction, performance or future with a leader in their last three months.
Four kinds of signal
The paper groups the twelve indicators by what they describe, so a monthly review can scan them in order.
Movement: who is leaving
First-year leavers by department, 12-month resignations by manager for teams of five or more, second and third exits in a department within 90 days, and voluntary exits against people let go. The turnover dashboard shows each one.
Voice: what people say
Agreement with "I expect to still be working here a year from now", the share of each team reporting a career or stay conversation, and the change in each manager's upward feedback since the last cycle, from manager and 360 surveys.
Structure and market
Managers with more than 10 direct reports or just one, people paid below their role's range, long gaps since a pay change or promotion, critical roles with no successor, and your voluntary exit rate beside the JOLTS quits rate for your industry.
Attrition analytics without an employee flight risk model
Most talk of an employee flight risk model means a score for each person. Organization Viewer's attrition analytics does not do that. Labels stick: a person marked likely to leave can be passed over, which can make the prediction come true. Small numbers mislead, because turnover in one team is a handful of events. And the levers that work, a pay review, support for a manager, a fix to onboarding, act on groups and conditions.
Departments and managers with fewer than five people are combined, and pulse results show only for groups of five or more responses, so no one's departure or answer can be singled out. The research still supports the approach: thoughts of quitting and job search are among the strongest correlates of actual turnover, and quitting spreads between coworkers.
The manager is the biggest lever
Gallup attributes at least 70% of the variance in team engagement to the manager, and four of the twelve indicators are about managers. Use manager data to support, not to rank: a falling score or a very wide span is a prompt for coaching or a structural change. The span of control analysis reports wide spans, single-report managers and extra layers.
A 45-minute monthly retention review
Scan the movement indicators, confirm group size and rule out one-off events, diagnose a likely controllable cause, agree one action with an owner and a date, and re-measure at the next two reviews. The cheapest action in the evidence is a conversation: ask managers in flagged teams to hold a stay conversation with every direct report this quarter.
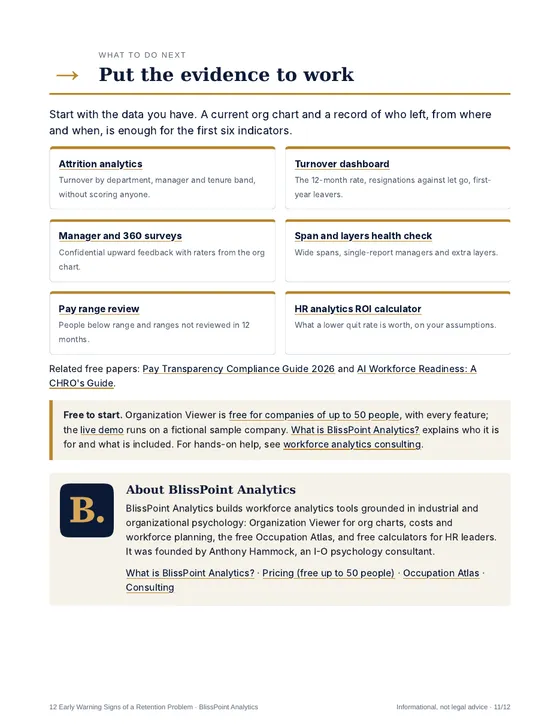
When finance asks what lower turnover is worth, the HR analytics ROI calculator values a lower quit rate on your own assumptions. Pay below range becomes more visible once ranges are posted; see the Pay Transparency Compliance Guide 2026.
Informational, not legal advice. Figures are cited to their sources in the PDF.
Frequently asked questions
What is a leading indicator of turnover?
A measure that tends to move before resignations do, such as first-year leavers, falling intent to stay or resignations clustering under one manager. The annual turnover rate is a lagging indicator: it moves after people have gone.
Should we give each employee a flight risk score?
BlissPoint Analytics does not. Individual probabilities are easy to misread, can label people, and rest on small numbers. Group-level indicators are enough to act on and avoid singling anyone out.
Where do the numbers come from?
Gallup's July 2024 study of voluntary leavers, the BLS Employee Tenure release for January 2026 and the BLS JOLTS release for September 2026, plus peer-reviewed turnover research. Each figure is cited in the PDF.
How often should we review these indicators?
Monthly for turnover by group and pay below range; after each survey for intent to stay and manager ratings. The paper includes a five-step monthly review.
What is attrition analytics?
Measuring where people are leaving, and the conditions that tend to come before it, for departments, managers and tenure bands. BlissPoint Analytics combines groups under five people so no one's departure can be singled out.
What is the cheapest retention action?
A conversation. In Gallup's 2024 study, 45% of voluntary leavers had no conversation about their satisfaction, performance or future in their last three months. The paper suggests a stay conversation with every direct report in flagged teams this quarter.